


When I think of “Open Source Software”, Linux, OpenOffice and GIMP come to my mind, but obviously, there are many more free computer programs for different purposes including image analysis (IA) of pathology slides.
This article explains the concept of Open Source Software and describes the 8 most popular open-source image analysis programs which can be used alone or in combination in pathology for analyzing whole slide images (WSI).
Open source software’s history is almost as long as software development itself. This way of developing software is meant to be based on sharing and collaborative improvement of source code. The interest in developing computer programs as open source increased significantly with the mainstream recognition of the open-source operating system Linux and the release of Netscape browser’s source code. In the late 1990s and in 1998 the Open Source Initiative (OSI) was established.
What is “Open Source” software?
Open-source software programs can be freely accessed, used, changed, and shared (in modified or unmodified form) by anyone. Open source software is made by many people and distributed under licenses that comply with the Open Source Definition
Open source licenses
Open source licenses are licenses that comply with the Open Source Definition — they allow the software to be freely used, modified, and shared. To be approved by the Open Source Initiative (OSI), a license must go through the Open Source Initiative’s license review process.
The list of open-source license types can be found here
Any software license and the software distributed under that license must meet the following ten criteria to be labeled “Open Source Software”:
- Free Redistribution
- The program must include source code and must allow its distribution
- Derived Works and modifications must be allowed
- Integrity of The Author’s Source Code
- No Discrimination Against Persons or Groups
- No Discrimination Against Fields of Endeavor
- Distribution of License
- License Must Not Be Specific to a Product
- License Must Not Restrict Other Software
- License Must Be Technology-Neutral
Can Open Source software be used for commercial purposes?
Yes, all Open Source software can be used for commercial purposes; the Open Source Definition guarantees this. You can even sell Open Source software.
However, commercial does not mean proprietary. When you distribute the software or its modified version, you must do it under the same type of license, i.e. you must keep it open source.

8 most popular free open source image analysis programs which can be used in pathology
Quantifying the visual information contained in pathology images with image analysis algorithms is becoming the state of art in life sciences. Here are a list and description of the 8 most popular open-source programs for this purpose, that can be used both by beginners and experts in image analysis. All the programs are stand-alone IA software with different capabilities and strengths, but many can be integrated with each other via plugins (software components that can be separately installed to add functionality), to increase their capabilities and address the unique IA problems every project carries.

1. Image J
ImageJ is a Java-based image processing program developed as a collaboration between the National Institutes of Health (NIH) and the Laboratory for Optical and Computational Instrumentation (LOCI) at the University of Wisconsin. ImageJ is probably the best-known and longest-lived open-source software for biomedical image analysis. Even though the program is so widely used, ImageJ is an experimental system and NIH does not assume any responsibility for its use by other parties. For use in a regulated environment, a separate validation and verification would be required by the end user.
Over the years a large set of ImageJ plugins, covering most areas of biological image analysis has been developed. Many of them have a simple graphical user interface (GUI), but some require programming skills to use.
ImageJ is compatible with over 150 different biological image formats called the Bio-Formats, WSI included. However, when it comes to WSI, not the format but the size of the image is the problem. To solve it, a plugin called SlideJ was developed. The plugin’s intended use is mainly rapid prototyping and testing of processing algorithms on digital slides aimed at research.
Download and tutorials
The software website provides tutorials and the software can be downloaded here.
There are also links to many presentations and key-note lectures about ImageJ. The ImageJ user community is large and active and one can ask questions and get feedback on the forum.

1a. Fiji (Fiji is just image J)
Fiji is a distribution of ImageJ. It is a “ready-to-use” bundle of ImageJ plugins for use in life sciences. The Fiji project was created to support the installation and maintenance of one of the more complex ImageJ plugins, TrakEM2, which provides comprehensive solutions for management, registration, segmentation, and annotation of large electron microscopy data sets. Subsequently, other advanced plugins for life science image analysis joined Fiji. Unlike in ImageJ, these plugins are curated and organized in categories in the plugin menu, making them more focused and easier to use.
WSI processing capabilities:
Yes, with the SlideJ plugin
Level of skills:
The software is primarily targeted at researchers with minimal computer skills, but because ImageJ functionality can be easily extended with plugins, it has also been attractive for researchers with software development skills.
How to cite
The funding of both ImageJ and Fiji is based on citations, so if you are using these programs for your research please cite the adequate papers, which can be found in the ImageJ citing guide.
Download and tutorials
Fiji can be downloaded here and tutorials can be found on the Fiji YouTube channel.

2. QuPath
Designed by Pete Bankhead at the Queen’s University Belfast QuPath is a comprehensive free open source desktop software application designed specifically to analyze WSI. Its primary use is biomarker analysis/ IHC quantification (whole slides and tumor microarrays), but it has also been used for tumor analysis on H&E.
It includes a user-friendly WSI viewer with smart annotation tools which use pixel information in the slide to accelerate the process and increase the annotation precision (e.g. semi-automatic delineation of the epidermis in a skin sample based on the contrast of stain between the epidermis and dermis) and extensive visualization tools.
QuPath offers both ready-to-use IA algorithms for solving such common pathology problems (such as automatic cells detection and classification for brightfield and fluorescent images) as well as building blocks which can be linked together to create custom workflows and batch-process the images. QuPath enables developers to add their own extensions to solve new challenges, implement new applications, and to exchange data with existing tools such as ImageJ and MATLAB.
QuPath’s functionalities include:
- Creation of multi-slide projects
- Stain estimation
- Cell detection and feature computation
- Trainable cell classification with the use of machine learning random trees classifier
- Batch processing
- Survival analysis tools to link the analysis results back to clinical data and uncover the roles of the biomarkers
- Fluorescence support
- Data exchange with existing software and platforms (e.g. ImageJ and MATLAB)
- Scriptable data mining
- Rapid generation, visualization, and export of spatial, morphological and intensity-based features
WSI processing capabilities:
Yes, the program is specially designed for handling WSI
Level of skills
Designed for pathologists and researchers without computer programing skills but researchers with software development skills can add their own extensions.
How to cite
When you use QuPath for your work cite: Bankhead, P. et al. QuPath: Open source software for digital pathology image analysis. Scientific Reports (2017).
Download and tutorials
QuPath can be downloaded here and the tutorials can be found on Pete Bankhead’s YouTube channel
And if you want to learn about the behind-the-scenes of QuPath creation listen to the podcast episode with Pete.

3. Cell profiler
Cell profiler developed by Broad Institute of MIT and Harvard is a MATLAB based free open source software, that enables biologists and scientists to analyze and batch-process cells in biological images. It has a flexible modular design and a user-friendly GUI which allows the user to point and click to do most tasks. The individual modules can be assembled into a pipeline, which later automatically analyzes the images. A typical pipeline consists of loading the images, correcting for uneven illumination, identifying the objects, and then taking measurements on those objects. These modules can easily be added, removed, or rearranged within a pipeline. The modules are executed in order and one can assess the performance of each module as they are being executed on the images. You can mix and match the modules and adjust parameters depending on the intended use. The analysis is object-based and identifies the objects analyzing such criteria as size and shape. The objects are detected/ generated hierarchically – primary objects eg. cell nuclei later serve as a base for secondary objects, like cells which consist of the previously detected nuclei and their surroundings defined by other features. Features like area, shape, color intensity, degree of correlation between colors, texture (smoothness), and the number of neighbors are measured per object. Outlines of the created objects are displayed as a mask over the original image, allowing for verification and quality control of the analysis. The program is able to extract metadata from the images. Small numbers of images can be processed automatically on a personal computer, and hundreds of thousands can be analyzed using a computing cluster. The software is not suitable for WSI analysis on its own, but it is possible when integrated with other programs, e.g. Orbit, which cuts the WSI into tiles and sends them to Cell profiler for analysis.
WSI processing capabilities:
Only after integration with other programs, e.g. Orbit
Level of skills
Designed for researchers without a background in computer vision or programming skills
How to cite
When you use Cell profiler for your research cite: Lamprecht, Michael R., David M. Sabatini, and Anne E. Carpenter. “CellProfiler™: free, versatile software for automated biological image analysis.” Biotechniques 42.1 (2007): 71-75.
Download and tutorials
Cell profiler can be downloaded here and the tutorials are available here. You can find the Cell profiler manual here.

3a. Cell profiler analyst
CellProfiler Analyst software was designed for the exploration of data generated by CellProfiler. It is not an image analysis but data analysis software.
Download and tutorials
Cell profiler analyst can be downloaded here and the tutorials are available here.
How to cite
When you use Cell profiler Analysts for your research cite: Jones TR, Kang IH, Wheeler DB, Lindquist RA, Papallo A, Sabatini DM, Golland P, Carpenter AE (2008) CellProfiler Analyst: data exploration and analysis software for complex image-based screens. BMC Bioinformatics 9(1):482

4. Ilastik
Ilastik is an easy-to-use free open source tool which allows users without expertise in image processing to perform segmentation and classification of 2, 3 and 4D images in a unified way. Through a random forest classifier, ilastik learns from labels provided by the user through a convenient GUI. Based on these labels, ilastik applies a problem specific segmentation.
Ilastik supports up to three spatial plus one spectral dimension and makes use of all dimensions in the feature calculation. The program provides real-time feedback that enables the user to interactively refine the segmentation results on the fly.
The program is able to improve the classification based on user feedback. The prediction by the classifier indicates where the classifier may still be wrong. It is shown on an overlay, called uncertainty map, which highlights regions in which the prediction is the most ambiguous. It guides the user to difficult image regions, where the classifier deems new labels most informative. Once ilastik has been trained on a set of representative images, it can be used to automatically process a very large number of images in a batch processing mode or using the CellProfiler pipeline. There is a possibility to integrate new analysis modules via a plug-in mechanism.
Future versions of the software will include:
- Seeded segmentation algorithms such as watershed
- Unsupervised dimension reduction techniques to help condense information from image features and multi-spectral images
- Hierarchical processing by allowing subsequent analyses on top of intermediate results
Ilastik is limited to local cues such as brightness, color, and texture and is not designed to capture global configurations thus the analysis of spatial relationships between different objects will not be possible.
The program is not designed to handle whole slide images, but in pathology, it has been used to detect mitotic figures in high power fields.
WSI processing capabilities:
No, but it can be used to analyze high power fields of pathology slides.
Level of skills
Designed for researchers without computer programing skills, but an understanding of image processing is helpful.
How to cite
When using ilastik for your analysis cite: Sommer, Christoph, et al. “Ilastik: Interactive learning and segmentation toolkit.” 2011 IEEE international symposium on biomedical imaging: From nano to macro. IEEE, 2011.
Download and tutorials
The software can be downloaded here and the tutorials can be found on the ilastik’s team YouTube channel. The users’ community also has a forum where users can have discussions and ask questions.

5. Orbit
Orbit Image Analysis is a free open source software for quantifying large-format images such as whole slide images of tissue. It can load images from local disk or connect to an Open Microscopy Environment image server (Omero) and can process images on a local computer or on a cluster using Spark job server.
Orbit can be used to specify a region of interest (ROI) in WSI. Processing WSI is possible due to a tile-based processing pipeline and working on different resolutions of the image. Later tiled sub-regions can be sent to CellProfiler for processing of individual cells in each tile. All tiles in the valid region of interest are processed via CellProfiler, the results are read back into Orbit where they can be visualized.
Features of the software include many built-in image analysis algorithms for tissue quantification using machine learning techniques, object/cell segmentation, and object classification to name a few.
Object detection is based on trainable foreground/background classes. Overlapping objects, e.g. cell clusters can be divided afterward. Features of objects (e.g. shape factors, area, intensities) can be computed and reported or used for object classification.
Segmented objects can be classified based on their features like size, shape factors or intensities. For instance, it can distinguish between stained and unstained cells or between round and edgy objects. This classification is based on machine learning; the user can specify classes by selecting examples
ROIs can be defined by manual annotations or via a trainable exclusion map which defines the “good” regions where the analysis should be performed. Both ways of defining ROIs can be combined.
For lung fibrosis model in rats and for glomeruli detection in rats and mice Orbit has ready to use, pre-trained models available.
Users with software development skills can create scripts and extensions and apply them to all tiles within the ROI. The program is also compatible with ImageJ and its plugins can be used for analysis.
The integration of Orbit with CellProfiler lets us use the CellProfiler image analysis functionalities on tiled WSI.
Even though Orbit is optimized for WSI (formats like: SVS, NDPI, NDPIS, SCN, AFI, CZI, IMS, VSI, ETS, SLD, TIF, TIFF, TF2, TF8, BTF) the software is compatible with all the formats from the Bioformats library.
WSI processing capabilities:
Yes
Level of skills
Designed for researchers without computer skills but researchers with software development skills can add their own extensions.
How to cite
I did not find an official recommendation for which publication to cite, but if I was using it for my research, I would cite this one: Goldberg, Ilya G., et al. “The Open Microscopy Environment (OME) Data Model and XML file: open tools for informatics and quantitative analysis in biological imaging.” Genome biology 6.5 (2005): R47.
Download and tutorials
The software can be downloaded here: https://www.orbit.bio/ and tutorial videos and different presentations about OME can be found on the OME YouTube channel https://www.youtube.com/channel/UCyySB9ZzNi8aBGYqcxSrauQ/videos

6. Cytomine
Cytomine is an open-source web-based annotation, image analysis and image management tool. It was designed for active and distributed collaboration of multidisciplinary teams for large-scale image-based studies.
The program supports various microscopy image formats (including most of the whole-slide scanner formats) either by directly accessing their native formats or conversion to a pyramidal format during the upload phase.
Cytomine lets the user organize, explore, share, and analyze (semantically and quantitatively) multi-gigapixel (including whole-slide pathology images) imaging data over the internet.
The program is optimized for collaborative projects allowing for user permission management on project and system levels.
The images can be uploaded to the Cytomine server from the user’s computer and are stored in the cloud. Later they can be organized into projects, explored in a web-based viewer, annotated, shared, reviewed, and analyzed both with available out-of-the-box algorithms as well as algorithms and models created from scratch by the user.
Interesting viewer and software features include:
- Viewing multiple images at the same time
- Access to slides and annotations by multiple collaborators at the same time
- Separate annotation layers for each contributor
- Ability to sort and search annotations by different attributes and filters (including generated automatically by an algorithm vs created manually)
- Use of annotations for deep learning model development
- Conversion of algorithm and model results into editable annotations that can be later used for the development of a different model
- Calculation of area in μm based on the image resolution
- Searching projects by keywords (tags, terms, properties)
- Creating “image groups” containing different stains of serial sections from the same block
WSI processing capabilities:
Yes.
Level of skills
Designed for collaboration of researchers without computer skills (annotations and included deployable algorithms and models) and researchers with software development skills who can add their own algorithms (scripts and apps) in different programing languages (Python, Java, JavaScript) or import algorithms from other software platforms (e.g. ImageJ, CellProfiler)
How to cite
Paper: Collaborative analysis of multi-gigapixel imaging data using Cytomine
Access and tutorials
The program can be accessed here: https://doc.cytomine.org/user-guide/getting-started#get-an-account
and the tutorials can be found on the Neubias YouTube channel:
Part 1 – focused on annotations
Part 2 – focused on image analysis applications and data management

7. Icy
Icy is a free open-source software founded by Institut Pasteur and France-BioImaging. As its website says, it is “a collaborative photoshop dedicated to image analysis”. Collaborative means that users with software development skills can add features to the program. In Icy users can visualize, annotate and quantify bioimaging data. It is designed as a common platform for image analysis scientists, who can develop new algorithms and life scientists looking for an intuitive tool for image analysis.
The GUI is designed based on components the user is already familiar with, e. g. the main ‘ribbon’ toolbar resembles Office Suite (Microsoft) and it provides access to all functionalities of Icy.
Icy integrates with ImageJ, MATLAB and Micro Manager.
WSI processing capabilities:
Yes
Level of skills
Designed for researchers with software development skills but intuitive enough to be used also by users without programming skills.
How to cite:
When using Icy for your research cite: De Chaumont, Fabrice, et al. “Icy: an open bioimage informatics platform for extended reproducible research.” Nature methods 9.7 (2012): 690.
Download and tutorials:
The program can be downloaded here and the tutorials can be found on icy’s YouTube channel.
8. PathML
PathML is not a classical image analysis software, but a free open-source toolkit that helps prepare images of different formats and different imaging modalities for image analysis workflows. It was developed by the researchers at the Dana-Farber Cancer Institute in Boston, MA, USA.
PathML provides a general framework for creating and running preprocessing pipelines on different image file formats.
The PathML library is written in Python 3
PathML supports several imaging modalities (H&E, IHC, IF, 3-D images etc. ) and 160+ common image formats including tiff, OME-TIFF, DICOM, svs, qptiff, and other proprietary file formats from scanners.
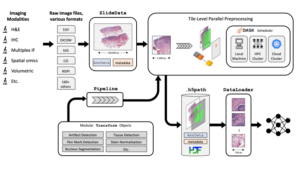 The first step in a PathML workflow is loading the raw image file to create a SlideData object, which is the central data class representing an image and associated metadata.
The next step is to create a preprocessing pipeline defined as the sequential application of independent building blocks, or transformations to image tiles. After that independently developed image algorithms can be applied to the images.
WSI processing capabilities:
Yes.
Level of skills
Designed for researchers with software development skills.
How to cite:
Code and documentation:
The code can be found on Github: https://github.com/Dana-Farber-AIOS/pathml and the documentation and example workflows can be found on the PathML project page: https://pathml.org/

Summary
Image analysis of pathology samples is becoming state of the art in biomedical research. Many companies provide high-value software and/ or services in this niche. But image analysis does not need to be expensive. There are many free open source programs with sophisticated image analysis capacities, several of which are specifically designed to handle WSI.
The eight most accessible, which can be used for analyzing pathology images are:
- ImageJ/ Fiji
- QuPath
- CellProfiler
- ilastik
- Orbit
- Cytomine
- Icy
- PathML
For more information about different image analysis programs visit the Bioimage Informatics Search Engine (BISE). This site is like Wikipedia for image analysis and contains curated information about countless commercial and open source image analysis programs.
References
- Schneider, Caroline A., Wayne S. Rasband, and Kevin W. Eliceiri. “NIH Image to ImageJ: 25 years of image analysis.” Nature methods7 (2012): 671.
- Rueden, Curtis T., et al. “ImageJ2: ImageJ for the next generation of scientific image data.” BMC bioinformatics1 (2017): 529.
- Bankhead, Peter, et al. “QuPath: Open source software for digital pathology image analysis.” Scientific reports1 (2017): 16878.
- Lamprecht, Michael R., David M. Sabatini, and Anne E. Carpenter. “CellProfiler™: free, versatile software for automated biological image analysis.” Biotechniques1 (2007): 71-75.
- Jones, Thouis R., et al. “CellProfiler Analyst: data exploration and analysis software for complex image-based screens.” BMC bioinformatics1 (2008): 482.
- Sommer, Christoph, et al. “Ilastik: Interactive learning and segmentation toolkit.” 2011 IEEE international symposium on biomedical imaging: From nano to macro. IEEE, 2011.
- Goldberg, Ilya G., et al. “The Open Microscopy Environment (OME) Data Model and XML file: open tools for informatics and quantitative analysis in biological imaging.” Genome biology5 (2005): R47.
- Marée, Raphaël, et al. “Collaborative analysis of multi-gigapixel imaging data using Cytomine.” Bioinformatics9 (2016): 1395-1401.
- De Chaumont, Fabrice, et al. “Icy: an open bioimage informatics platform for extended reproducible research.” Nature methods7 (2012): 690.
- Rosenthal, Jacob, Ryan Carelli, Mohamed Omar, David Brundage, Ella Halbert, Jackson Nyman, Surya N. Hari et al. “Building tools for machine learning and artificial intelligence in cancer research: best practices and a case study with the PathML toolkit for computational pathology.” Molecular Cancer Research 20, no. 2 (2022): 202-206.
related contents
- Virtual H&E. How Instapath uses optical sectioning microscopy to accelerate pathology diagnosis w/ David Tulman, Instapath
- 10+ best pathology resources for tissue image analysis
- Instance segmentation for digital pathology tissue image analysis – what is it and why do we need it?
- HistoQC, an open-source way to control the quality of pathology images
- Digital Pathology 101 Chapter 5 | The Role of Whole Slide Imaging in Toxicologic Pathology
Comments are closed.