Image analysis (IA) as part of digital pathology has been around quite some time already. In fact, the first systems for remote pathologic diagnosis (video-based) were demonstrated in the USA in 1968. Since then enormous advancements in technology have been made, but the penetration of digital pathology applications in the clinical space remains limited.
There may be various reasons, but one, very important is compliance with regulatory requirements. The tissue image analysis space for research is pretty dynamic, and there are several companies competing with each other in providing research use only solutions for pathology support. Many pharmaceutical companies have their own computational pathology divisions that support their drug development.
But how many of these offered solutions and developed image analysis algorithms meet regulatory standards? And of the ones that don’t, how many will make it into the clinic to actually improve healthcare? And is this even the intention?

It all started with cytology
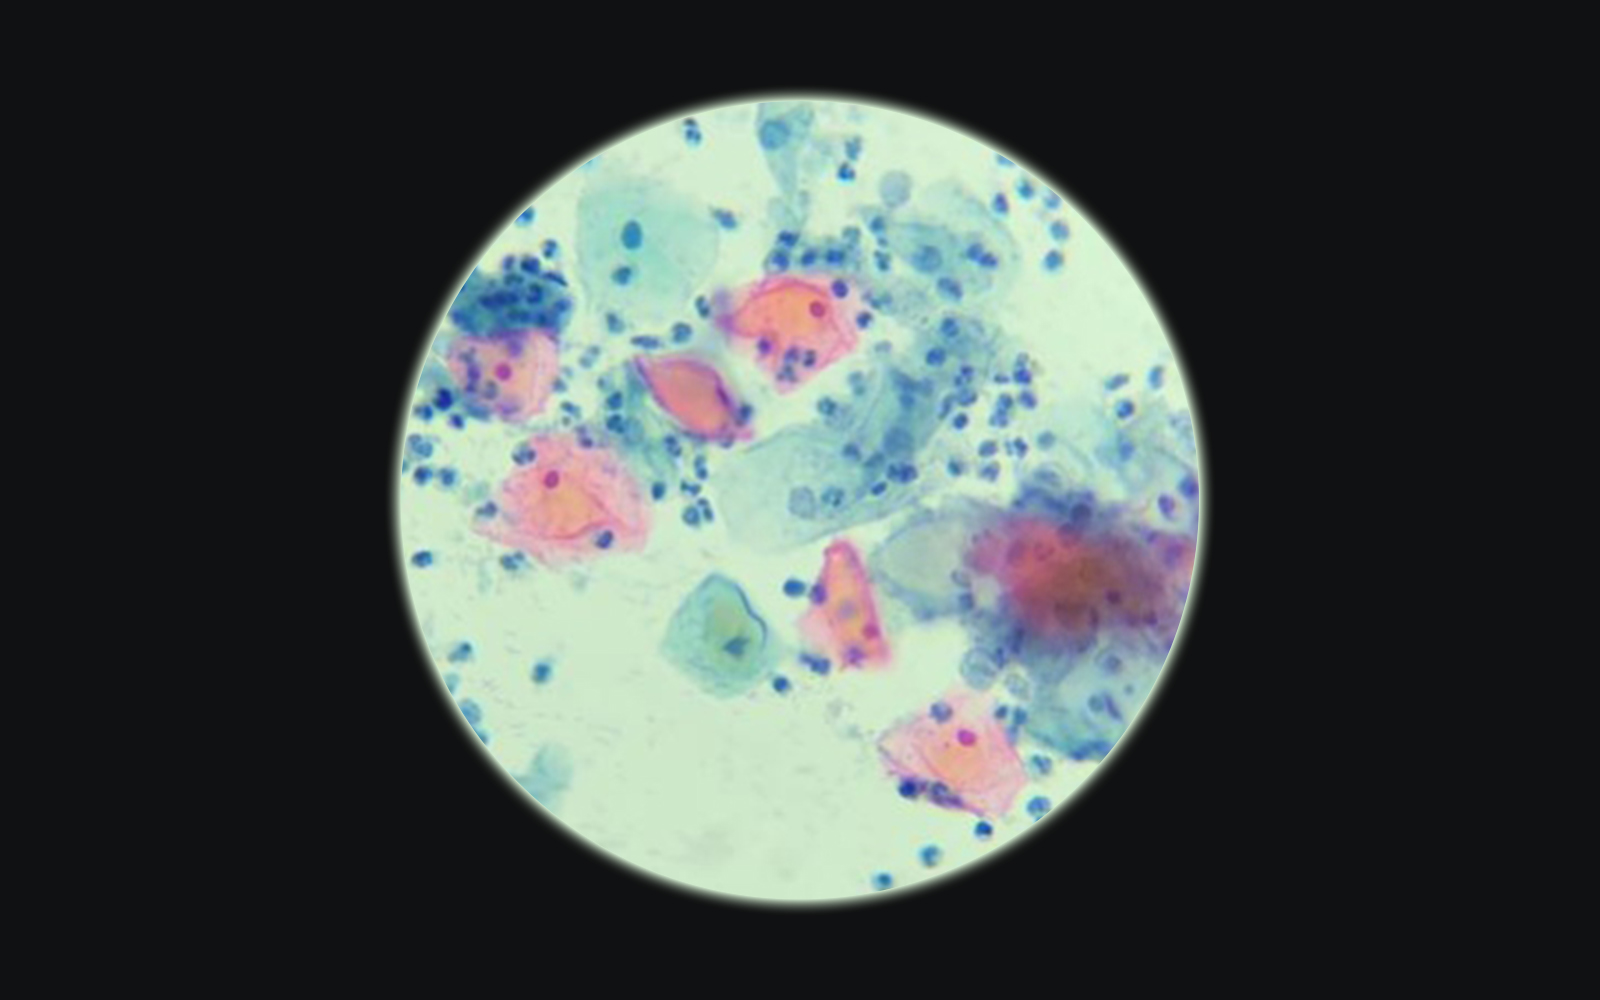
The Papanicolau test (also known as the Pap test, Pap smear or smear test) is the most widely used screening method for uterine cervical cancer in women worldwide. It consists of an evaluation of a cytology smear from the uterine cervix in search of morphologically abnormal cells indicative of precancerous lesions or cancer. It is indicated to be performed in women 21-65 years of age every 3- 5 years if the results of the tests are normal.
This gives a patient population of ca. 2 billion worldwide.
With such number of patients to screen, no wonder doctors and scientists started to search for a more efficient method of evaluation, than visual assessment under the microscope, in which cytotechnologists and pathologists are intensely involved, and according to the Clinical Laboratory Improvement Act (CLIA) they should not exceed 100 slides a day, as above this number the accuracy of the diagnosis decreases significantly.
The work on automating the Pap test started in the 1950’s already, but only in the 1990’s did the first commercial computer-assisted pathology solutions based on image analysis algorithms received FDA approval. The approved devices –
AutoPap 300 QC (NeoPath, Redmond, WA, USA) and the PapNet (Neuromedical Systems Inc., Suffern, NY, USA)
were first approved for quality control purposes only – for rescreening of smears previously visually classified as negative (that did not really reduce the workload, however, it improved the quality and reduced the number of false negative results due to human error).
Later one of them – AutoPap 300 QC, based on handcrafted image analysis algorithms and a scoring system derived from them, was approved as a primary screening device for a limited number of slides (up to 25% of the total workload).
The PapNet was based on neural network processing and pattern recognition, but the company went bankrupt, and the device was discontinued…The AutoPap remained and is now sold by BD as BD FocalPoint™ GS Imaging System, but is still only allowed to screen 25% of the slides automatically without the necessity for human revision…
Nice, but not too impressive (I personally would expect a lot more in the digital era we are living in, but the return on investment must not be so great if it didn’t really take off…)

The next big thing: tissue-based biomarker quantification
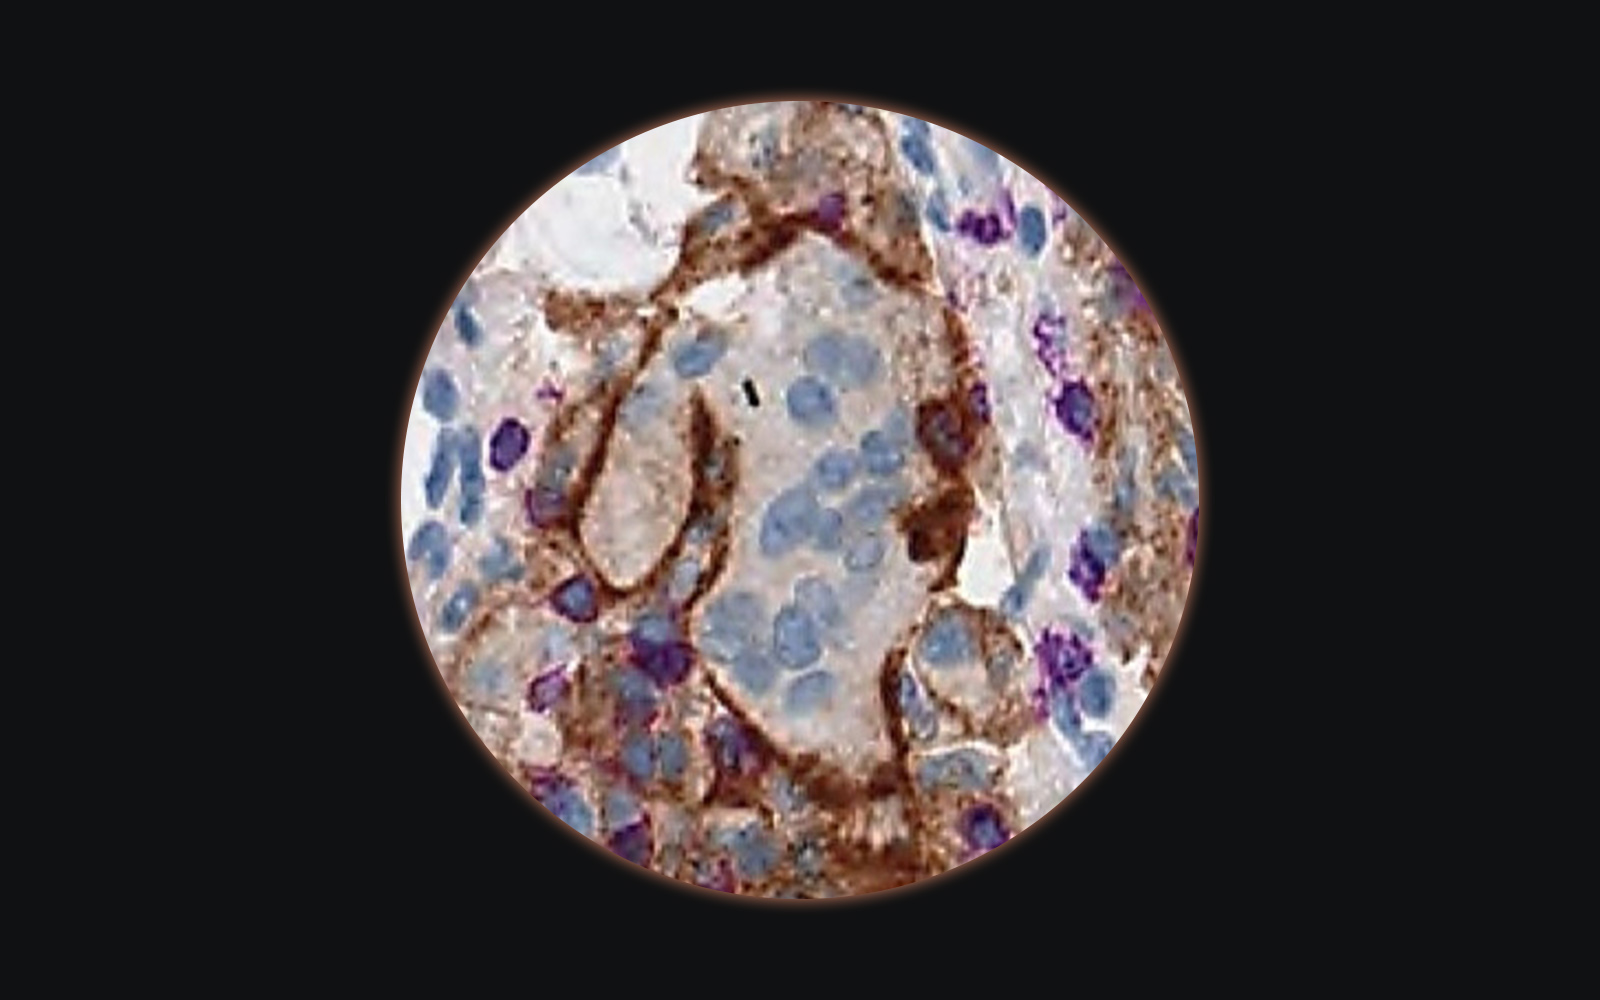
The area of drug development currently mostly invested in is oncology. Some of the cancer drugs rely on tissue biomarkers quantified by immunohistochemistry (IHC) for patient stratification. This method is rather qualitative than quantitative, nevertheless, quantitative pathology scores relying on visual estimation of the percentage of positivity and intensity of staining of tumor cells have been developed.
One would think, that to avoid adding the variability of pathologist’s interpretation to the process, consisting of tissue processing, IHC assay, and interpretation, biomarker quantification would be a perfect field for applying image analysis and make the quantification objective and reproducible, however so far out of the following five predictive IHC biomarker tests approved by the FDA as companion diagnostics:
- Programmed Death Ligand 1 (PDL1) in non-small cell lung cancer, gastric or gastroesophageal junction adenocarcinoma, cervical cancer, urothelial carcinoma;
- Anaplastic Lymphoma Kinase (ALK) in non-small cell lung cancer,
- Epithelial Growth Factor Receptor (EGFR) in colorectal cancer,
- c-kit receptor (CD 117) in gastrointestinal stromal tumor and
- human epidermal growth factor receptor 2 (Her2) in breast cancer, gastric cancer
for only one – Her2 – have image analysis quantification algorithms been FDA cleared (from BioImagene, Aperio Technologies, Tripath Imaging, Applied Imaging, Ventana Virtuoso Systems, and Clarient).
The fact that most of the scoring guidelines rely on visual estimation (or better said “guestimation”) of the amount of positive tumor tissue should be an argument strong enough for the quick development of reliable image analysis solutions. The task of estimating the amount of positive stain in an image simply is not a strength of the human brain. We are very good in recognizing different patterns and structures, but miserable at quantifying them, especially around the cut-off values, where interobserver variability is extremely high and may lead to misclassification of as many as 50% of the patients.
Apart from the predictive biomarkers which are part of companion diagnostic tests, there are a few other biomarkers used in the clinical practice, which interpretation benefits from the use of an image analysis algorithm.
The ones currently FDA cleared and routinely used in breast cancer diagnostics and treatment are:
- Estrogen Receptor (ER),
- Progesterone Receptor (PR), both used for qualifying patients for hormone therapy
- p53 protein, responsible for activating apoptosis,
- Ki67, indicating tumor proliferation index – both used as prognostic markers.
A comprehensive list of FDA 510 (k) clearances for image analysis algorithms was provided by the Digital Pathology Association.
Is there another way to use image analysis in IHC quantification? – Laboratory Developed Tests (LDTs)
One reason for the limited number of quantifiable IHC biomarkers is the biology itself, another is the state of discovery. There may just not be so many relevant biomarkers detectable by IHC or they may have not yet been discovered.
On top of that, even though IHC is a widely available method, standardizing this type of assay for image analysis is a complex process, which is not always possible. Both, the preanalytical and analytical phase of IHC include multiple steps, each of which may contribute to the variability in results and differences in interpretation. This makes it difficult to keep the assays consistent across laboratories and scale up the availability of the test. Image analysis algorithms are just the final, quantifying part of the process, usually optimized to a particular appearance (certain staining pattern and intensity, certain slide thickness etc.). If any of these aspects changes, the algorithm will no longer provide correct results. This is why the whole process needs to be strictly standardized, which is not always possible when working across laboratories.
A way of overcoming this is to keep the process restricted to one laboratory and to control as many steps of the process as possible. This is how Laboratory Developed Tests (LDTs) are created. The samples are usually sent to a particular lab for analysis and most of the steps from tissue processing, through sectioning, staining all the way to the image analysis take place there. In this scenario, it is possible to control most of the process and thus provide the most consistent results. Examples of LDT’s with an image analysis component are:
- The ProMark test from Metamark Genetics which quantifies with image analysis a multiplex immunofluorescence (IF) assay
- Ki67 IHC quantification by NeoGenomics (https://neogenomics.com/)
There may be many more LDT’s on the market, which incorporate an image analysis component. These tests are under the oversight of Clinical Laboratory Improvement Amendments (CLIA) enforced by the Centers for Medicare & Medicaid Services (CMS).
What about research? – Research Use Only (RUO)
Many of the pathology supporting algorithms will never enter the regulated environment, meaning they will never comply with the strict regulations. They will remain for research use only. This is not necessarily bad, as there is not always a need to go this route. This, however, doesn’t mean, that there should be total freedom in their design and their interpretation. As each scientific method supporting bio-technological discoveries, image analysis for IHC quantification should always be tested for its specificity, sensitivity, and accuracy, before data is generated.
Summary
Even though the work on including IA algorithms in pathological evaluation already started in the 1960’s relatively few of them received approval from regulatory bodies.
The first FDA approved algorithms were used in cytology for automated evaluation of Pap smears and are now sold as part of the BD FocalPoint™ GS Imaging System
Another important application of IA solutions is the quantification of IHC biomarkers. The following markers received FDA clearance for digital quantification:
- Human Epidermal Growth Factor Receptor 2 (Her2) in breast cancer, gastric cancer
- Estrogen Receptor (ER),
- Progesterone Receptor (PR), both used for qualifying patients for hormone therapy
- p53 protein, responsible for activating apoptosis,
- Ki67, indicating tumor proliferation index – both used as prognostic markers.
Another way of introducing IA into the regulated environment is its incorporation in LDT’s like:
- The ProMark test from Metamark Genetics which quantifies with image analysis a multiplex immunofluorescence (IF) assay
- Ki67 IHC quantification by NeoGenomics
Even though the number of regulated IA powered pathology tests is limited, the number of RUO applications is growing. A thorough internal validation of these tests and tools should be performed, before data for research support is generated.


Comments are closed.